Great Gadgets
- Karen Jennings
What is Great Gadgets
Great Gadgets is an add-on for Jira that offers a suite of gadgets that you can add to your Jira dashboards for making them more powerful and this way to improve the efficiency and effectiveness of your team.
The add-on supports Jira Cloud, Jira Server and Jira Data Center.
How to use
Great Gadgets add-on consists in a suite of gadgets that you can use in your Jira dashboards.
To add a gadget to a dashboard:
- In Jira, go to Dashboards
- Create a new dashboard or select an existing one
- Click the Add gadget button of the dashboard
- In the "Add a gadget" screen, filter by "great" or "StonikByte" to display all the gadgets of the add-on
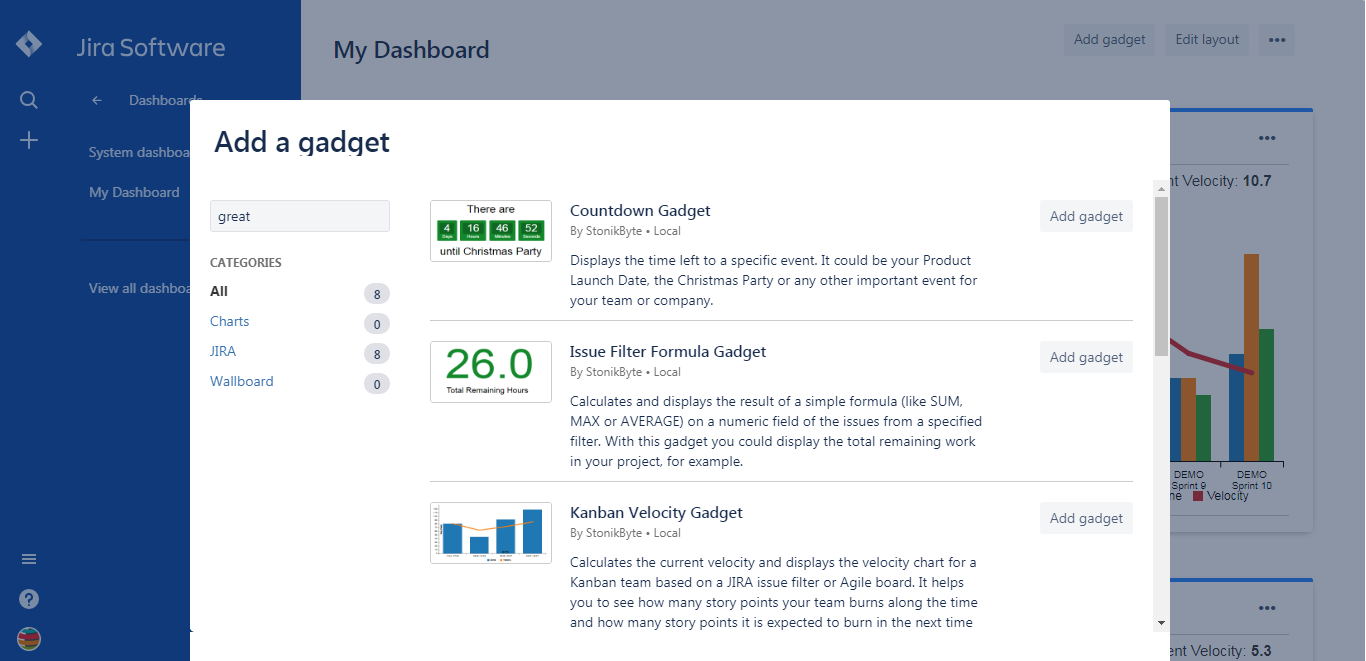
- Click the "Add gadget" button of the gadget that you want to add
- Once you added the gadgets, close the "Add a gadget" screen and continue by entering the gadget settings. See below the instructions for how to configure the gadgets.
Gadgets Offered
The current version of Great Gadgets includes the following gadgets.
| Gadget | Category | Description |
|---|---|---|
| Agile, Project Management | Release Burnup Burndown Chart Gadget Displays the Burnup or Burndown chart for a Jira issue filter representing your release scope. Use this gadget to track the progress of your project in an agile manner. Read More... | |
| Agile, Project Management | Sprint Burnup Burndown Chart Gadget Displays the Burnup or Burndown Chart for a selected Agile sprint. Use this gadget to track the progress of your Agile team during the sprint. Read More... | |
| Agile, Project Management | Team Velocity Gadget Calculates and displays the current average velocity of the Agile (Scrum) team along with the history of previous sprints. The team's velocity is an essential metric that helps the Agile teams not to over-commit during sprint planning meeting, but also helps them to see how they perform from a sprint to another. Read More... | |
| Agile, Project Management | Kanban Velocity Gadget Calculates and displays the current average velocity of the Agile (Kanban) team based on the Jira issue filter or Agile board. Use this gadget to see how many story points your team burns along the time. Read More... | |
| Agile, Project Management | Cycle Time Trend Gadget Calculates the key Kanban metrics Cycle Time and Lead Time or simply the time between statuses and displays them as a trend chart. Use this gadget to see how fast your team delivers and to identify bottlenecks in your process flow. Read More... | |
| Agile, Project Management | Work Breakdown Structure (WBS) Gadget This gadget offers the Work Breakdown Structure (WBS) diagram in form of Epic > Parent Tasks > Sub-Tasks for the issues from a Jira filter. With this gadget you have the high-level status of your epics or the entire project. Read More... | |
| Project Management | Issue Filter Formula Gadget Calculates and displays the result of a simple formula (like SUM, MAX or AVERAGE) on a numeric field of the issues from a specified Jira issue filter. Use this gadget to sum-up and display the total remaining work or the work done in your project, for example. Read More... | |
| Project Management, Time Management | Countdown Gadget This gadget shows the remaining time until an upcoming event. Use this gadget to make your team aware of the remaining time until the next project launch or milestone, the Christmas Party or any other important event for your team or company. Read More... | |
| Time Management | Regional Clock Gadget This gadget shows the current time in a specific location in a digital clock format. It is useful for companies with multiple offices across the world or geographically distributed teams. Use this gadget to make your team members know what the current time is in the other offices so they can better synchronize with the remote people. Read More... |
Gadgets Description
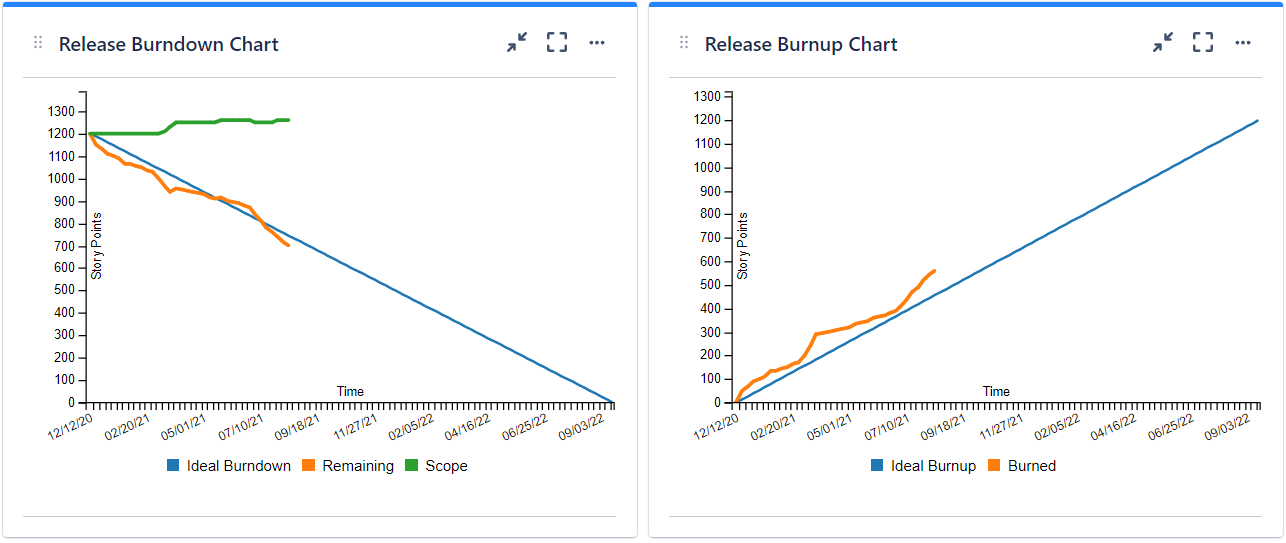
Release Burnup Burndown Chart
Displays the burnup and/or burndown chart for a project release represented by a Jira issue filter. The calculation can be done by Story Points, Original Time Estimate or Issue Count and is based on historical data of every issue from the specified filter. The series to be displayed are configurable, thus allowing you to use the gadget as burndown, burnup or both. Use this gadget to track the progress of your project release in an agile manner.
This gadget can also make a forecast (prediction) about when the release will be finished. How the forecast is made? First, the gadget determines the current velocity of your team based on the work done in the previous completed time intervals (Yesterday’s Weather). Then, it determines how many days are necessary to finish the current remaining work assuming that your velocity remains the same and it draws the dashed line accordingly to the determined release end-date.
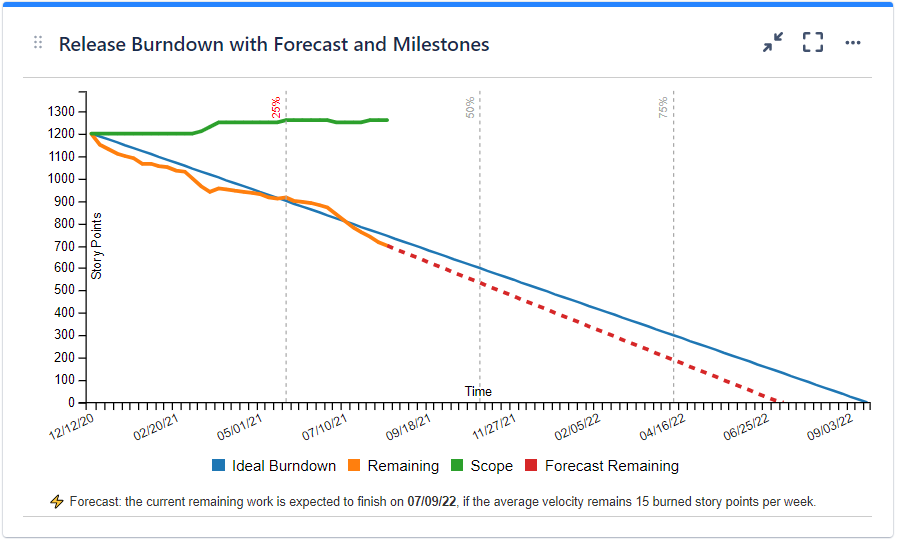
See the settings description below for how to configure the gadget.
| Setting | Description |
|---|---|
| Gadget Title | Choose what to display in the title bar of the gadget. |
| Release Issue Filter | The Jira filter that contains the issues in your release (the scope of your project release). Note: Only the parent tasks are considered in calculations; the subtasks are ignored. Make sure that the specified filter is shared if you want the other people to visualize the dashboard. |
| Release Start Date | The start date of your release. |
| Release End Date | The end date of your release. |
| Group Data By | Indicates the time interval for calculating the chart data. If you use Agile development, this should be set according to your sprint duration. |
| "Done" means | Specify how to consider the issue as being "done". If you use Agile development, you should select the Agile board of your team. |
| Calculate by | Specify on which criteria the calculation to be performed. You can choose between: Story Points - the default value, use this if the issues are estimated in Story Points Original Time Estimate - use this if you use time estimates; calculation will be done in hours Issue Count - use this if you want the calculation to be done by number of issues |
| Forecast made by: | Specifies how the forecast about release end-date is made. It takes effect over the Forecast burndown and Forecast remaining series in case you choose to display any of them. You can choose between: Average velocity of all the completed intervals - the forecast will be made based on the average velocity of all the previous completed intervals Average velocity of the last ? intervals - the forecast will be made based on the average velocity of the last ? intervals as specified |
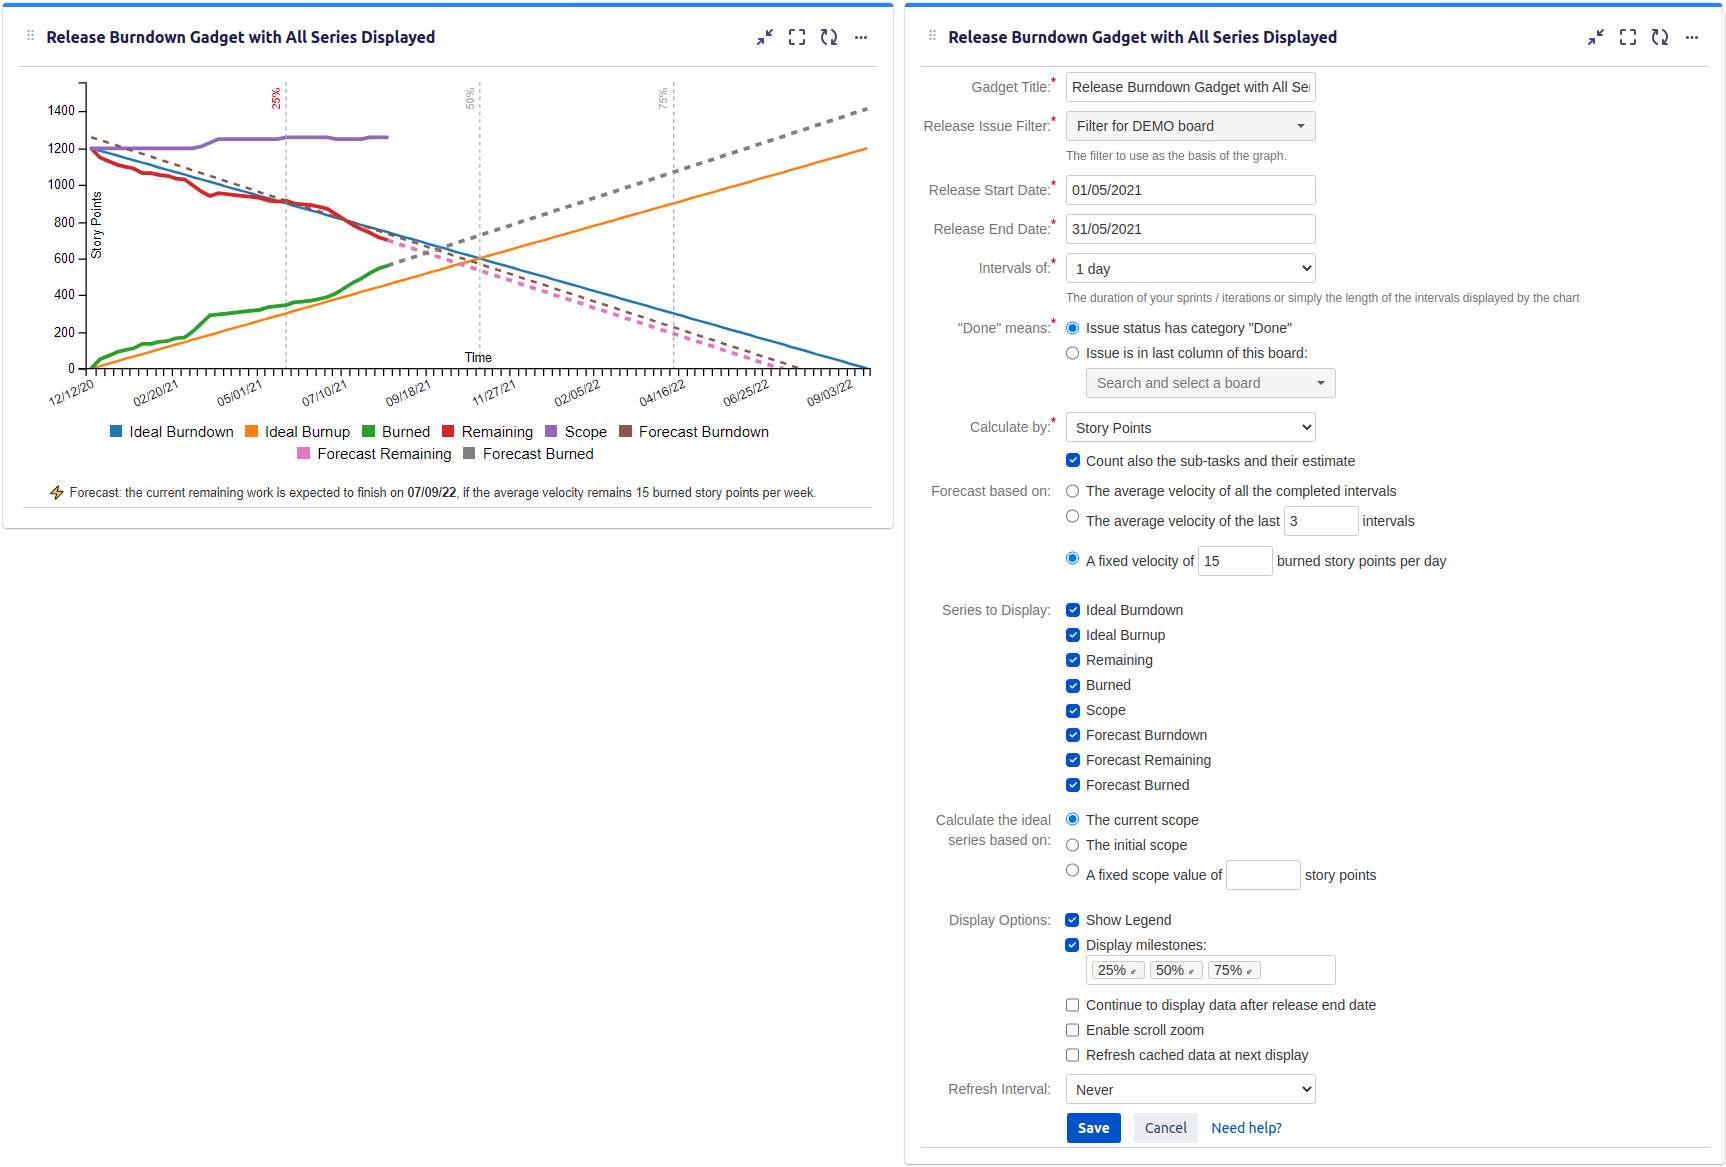
| Series to Display | Choose what series to display in the chart. You can select one or more options: Ideal Burndown - the ideal line specific to a burndown chart. It indicates how the remaining work should evolve in the ideal case. It is calculated based on Current scope (see bellow). Ideal Burnup - the ideal line specific to a burnup chart. It shows how the done (burned) work should evolve in the ideal case. It is calculated based on Current scope (see bellow). Remaining - the total amount of remaining work at that time; it is specific to burndown chart Burned - the total amount of work done at that time; it is specific to burnup chart Current scope - represents the current release goal - the total amount of work to be done in the release at that time. Select this if you want to see the changes in the release scope along the time. Forecast burndown - makes a forecast (prediction) about when the remaining work is finished and displays it as dashed line between the start of the release and the estimated release end-date. Forecast remaining - makes a forecast (prediction) about when the remaining work is finished and displays it as dashed line between the end of the Remaining line and the estimated release end-date. |
| Show legend | Check this if you want the chart legend to be displayed. |
| Tilted labels for x-axis (avoid overlapping) | Check this to avoid overlapping of the x-axis labels. |
| Refresh cached data at next display | This gadget uses data caching for faster display, which means that some data resulted after processing are saved and reused next time when the gadget is loaded. It is recommended to let this option unchecked for faster loading of the gadget. You can check it and then refresh the gadget if you want to clear the cache or you can leave it checked for disabling the usage of data caching. |
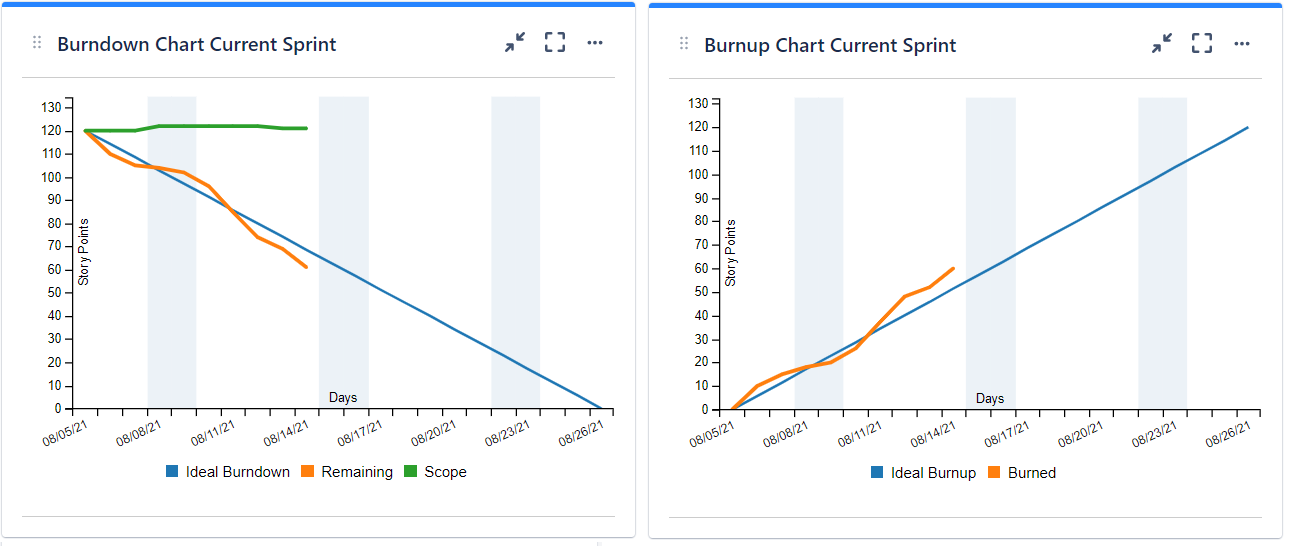
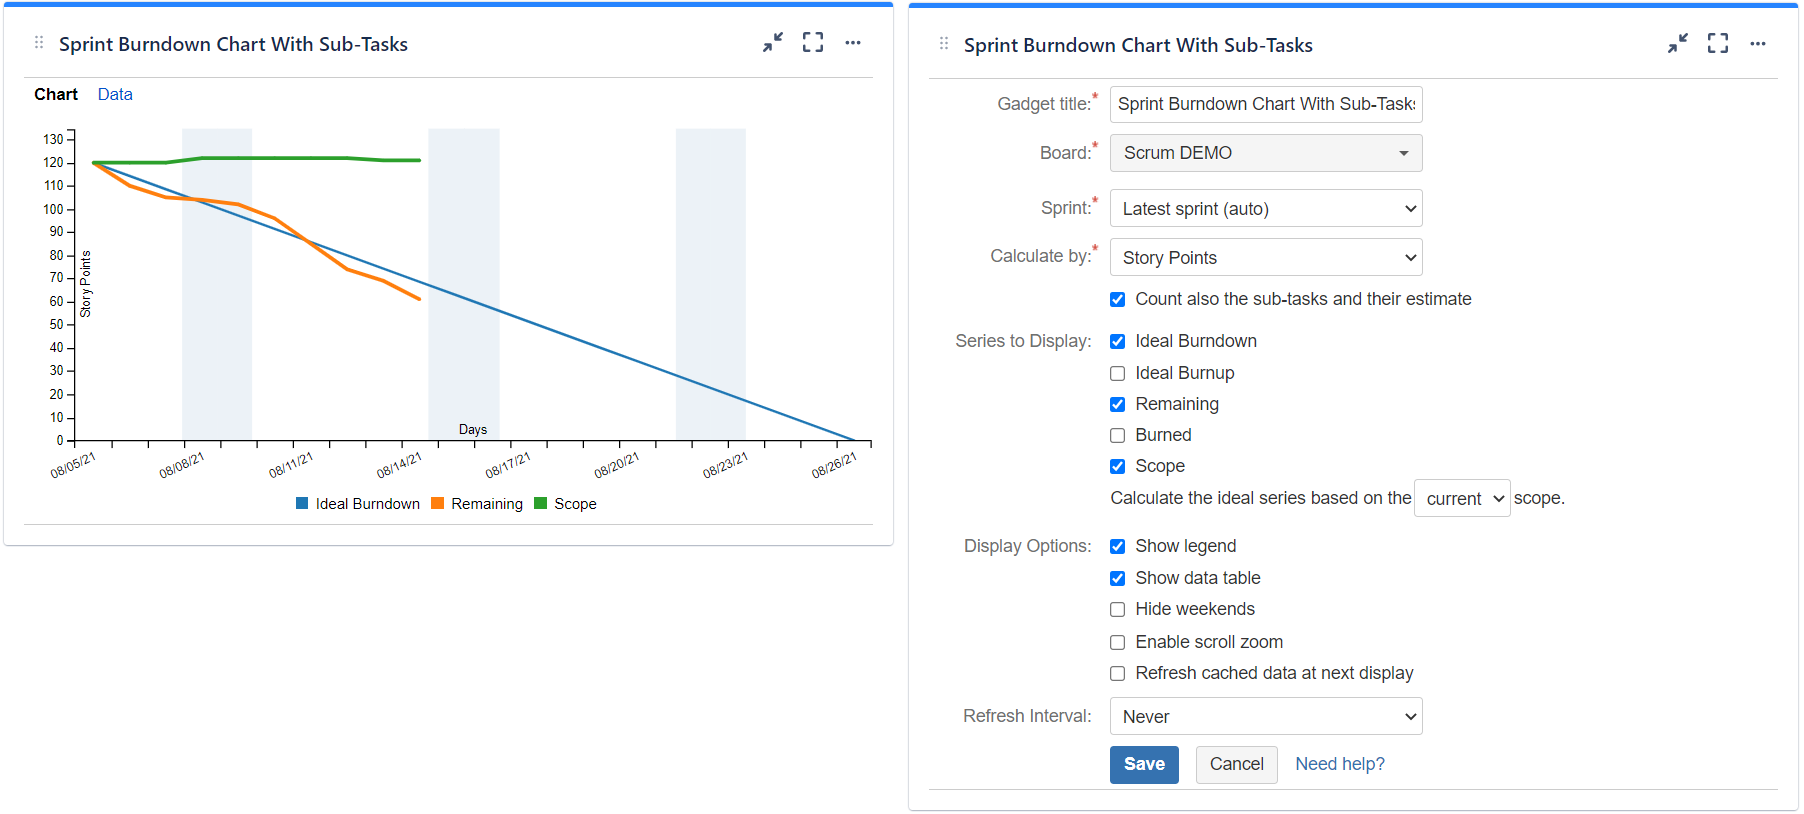
Sprint Burnup Burndown Chart
Displays the burnup and/or burndown chart for a specified sprint. The calculation can be done by Story Points, Original Time Estimate or Issue Count and it is based on historical data of every issue in the sprint. The series to be displayed are configurable, thus allowing you to use the gadget as burndown, burnup or both. Use this gadget to track the progress of your Agile team during the sprint.
See the settings description below for how to configure the gadget.
| Setting | Description |
|---|---|
| Gadget Title | Choose what to display in the title bar of the gadget. |
| Board | Choose the Scrum board that contains your Agile sprint. |
| Sprint | Choose the sprint for which to display the data. If you select Latest sprint (auto) the most recent sprint that is either closed or active will be used. Use this option if you want not to set the sprint manually all the time. |
| End date is | Choose what period of time to display in the chart: until Sprint End Date (when the sprint was supposed to be finished) or until Sprint Closure Date (when the sprint was closed). |
| Calculate by | Specify on which criteria the calculation to be performed. You can choose between: Story Points - the default value, use this if the issues are estimated in Story Points Original Time Estimate - use this if you use time estimates; calculation will be done in hours Issue Count - use this if you want the calculation to be done by number of issues |
| Series to Display | Choose what series to display in the chart. You can select one or more options: Ideal Burndown - the ideal line specific to a burndown chart. It indicates how the remaining work should evolve during the sprint in the ideal case. It is calculated based on Current scope (see bellow). Ideal Burnup - the ideal line specific to a burnup chart. It shows how the done (burned) work should evolve during the sprint in the ideal case. It is calculated based on Current scope (see bellow). Remaining - the total amount of remaining work at that time; it is specific to burndown chart Burned - the total amount of work done at that time; it is specific to burnup chart Current scope - represents the current sprint goal - the total amount of work to be done in the sprint. Select this if you want to see the changes in the sprint scope along the time. |
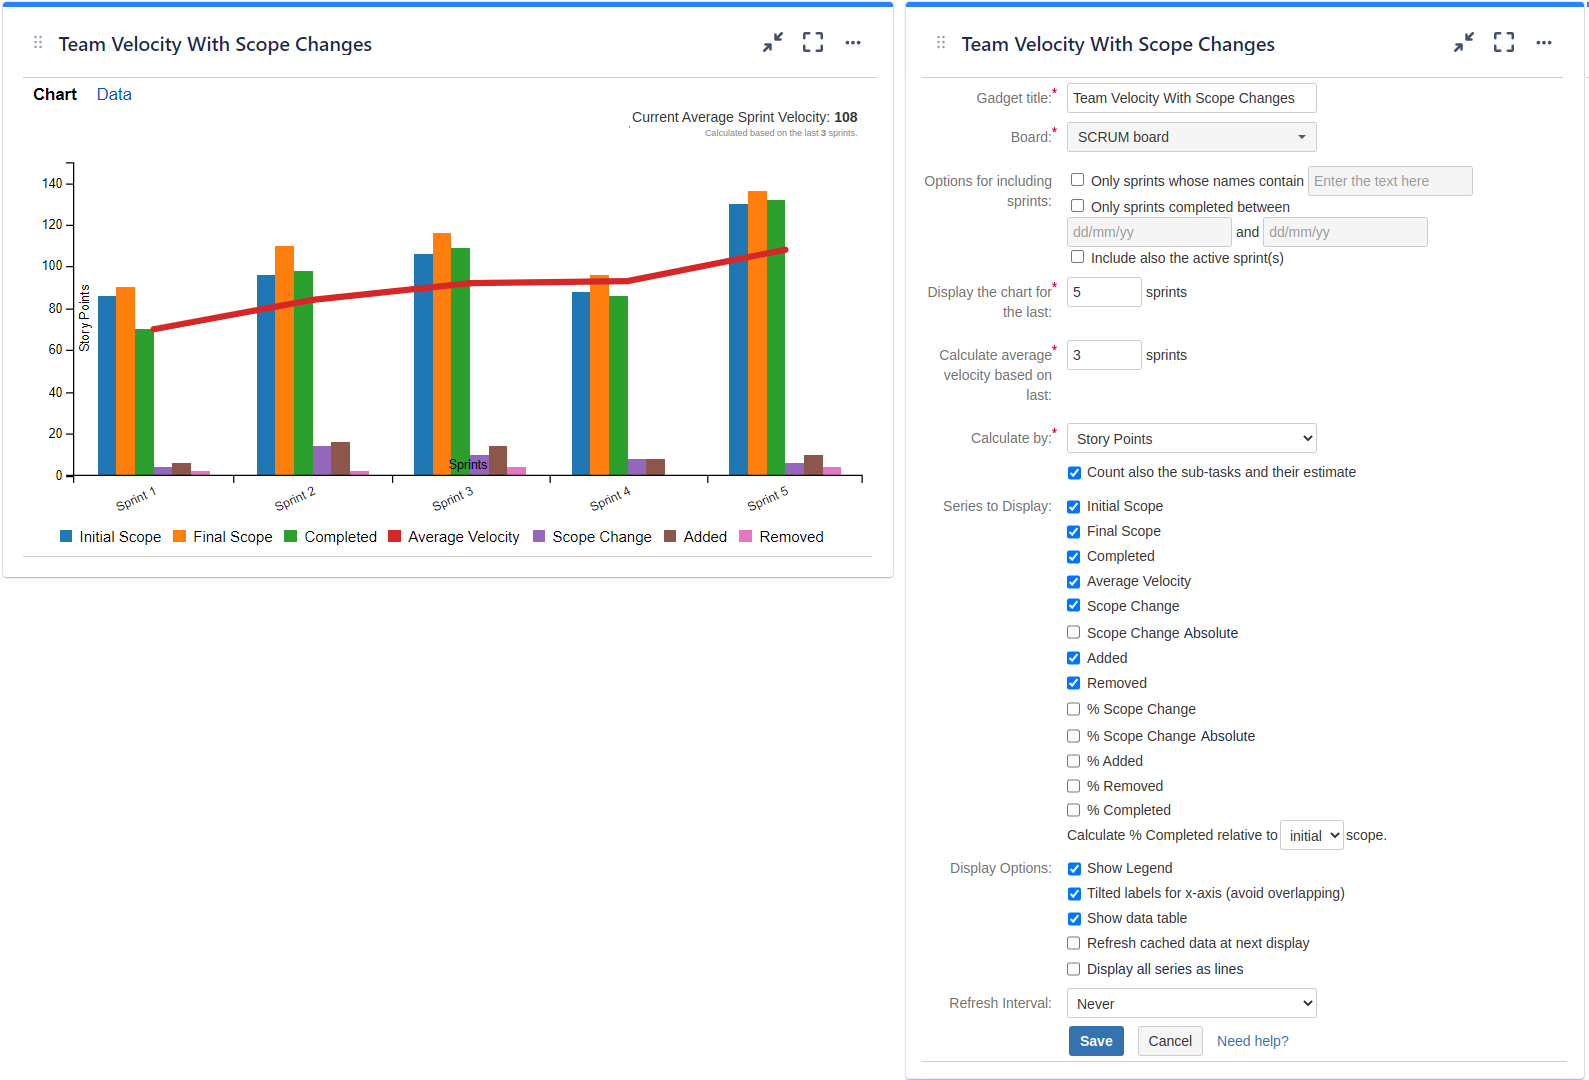
Team Velocity Gadget
Calculates and displays the current average velocity of the Agile team along with the history of previous sprints. The calculation can be done by Story Points, Original Time Estimate or Issue Count and it is based on historical data of every issue. The team's velocity is an essential metric that helps the Agile teams not to over-commit, but also helps them to see how they perform from a sprint to another.
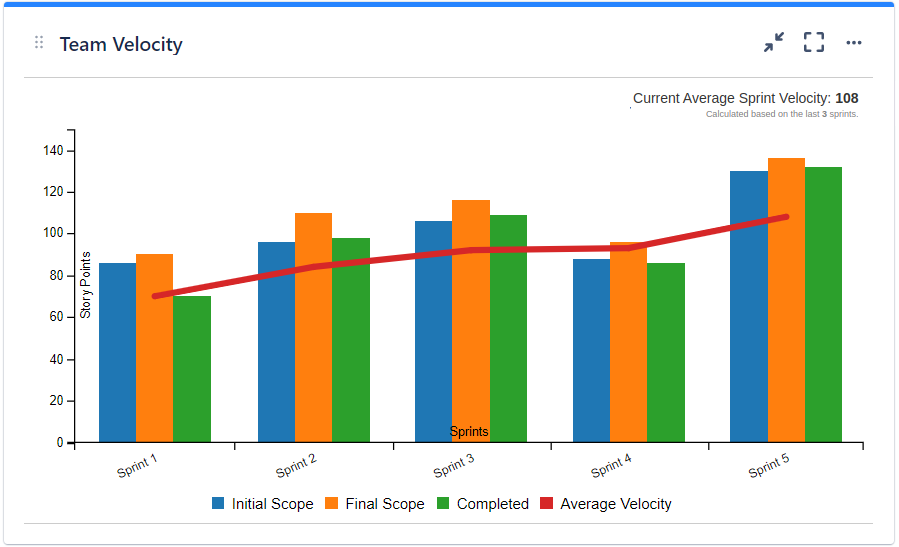
Initially Commited - Indicates the team's commitment when the sprint was started.
Finally Commited - Indicates the team's commitment at the end of the sprint, after the scope change. This helps you to determine if your team tends to change the sprint scope and how much.
Done - The total amount of work done in that sprint.
Velocity - The average velocity calculated as the average of done work on the last sprints, according to the gadget's settings.
See the settings description below for how to configure the gadget.
| Setting | Description |
|---|---|
| Gadget Title | Choose what to display in the title bar of the gadget. |
| Board | Choose the Scrum board of your team. |
| Sprint name contains | Optionally, if you want only specific sprints to be considered during calculation. If not checked, any sprint visible on the selected board will be displayed. |
| Display the chart for the last ? sprints | Specify the number of previous sprints to be displayed in the chart, starting from the most recent. |
| Calculate average velocity based on last ? sprints | Specify the number of previous sprints to be used when calculating the average velocity. Velocity is calculated as the average of the total SPs done in each of these sprints. |
| Calculate by | Specify on which criteria the calculation to be performed. You can choose between: Story Points - the default value, use this if the issues are estimated in Story Points Original Time Estimate - use this if you use time estimates; calculation will be done in hours Issue Count - use this if you want the calculation to be done by number of issues |
| Show legend | Check this if you want the chart legend to be displayed. |
| Tilted labels for x-axis (avoid overlapping) | Check this to avoid overlapping of the x-axis labels. |
| Refresh cached data at next display | This gadget uses data caching for faster display, which means that some data resulted after processing are saved and reused next time when the gadget is loaded. It is recommended to let this option unchecked for faster loading of the gadget. You can check it and then refresh the gadget if you want to clear the cache or you can leave it checked for disabling the usage of data caching. |
Kanban Velocity Gadget
Calculates and displays the current average velocity of the Agile team that is using Kanban based on a Jira issue filter or an Agile board. The calculation can be done by Story Points, Original Time Estimate or Issue Count and it is based on historical data of every issue. Use this gadget to see how much work your team burns along the time and how much work is expected to burn in the next period.
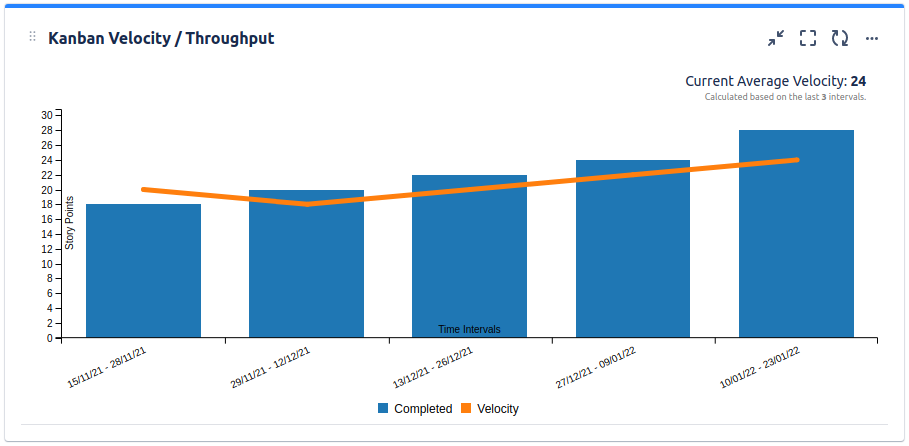
Done - The total amount of work done in that time interval, calculated in story points, hours or number of issues according to the gadget's settings.
Velocity - The average velocity calculated as the average of done work on the last time intervals, according to the gadget's settings.
See the settings description below for how to configure the gadget.
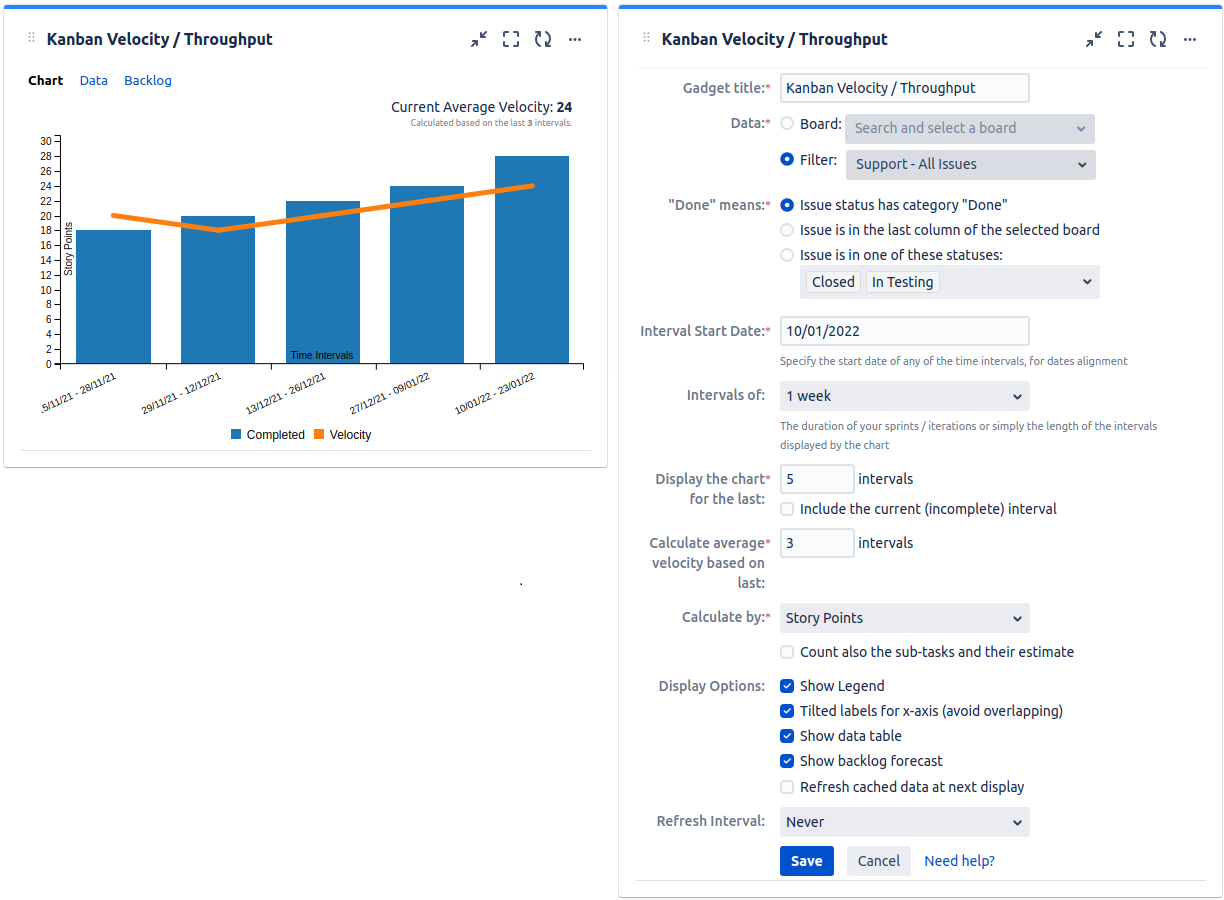
| Setting | Description |
|---|---|
| Gadget Title | Choose what to display in the title bar of the gadget. |
| Data | Choose the board of your team or specify a Jira issue filter representing the scope of your project. Note: Only the parent tasks are considered in calculations; the subtasks are ignored. Make sure that the specified filter is shared with the users who will also visualize this gadget. |
| "Done" means | Specify how to consider the issue as being "done". If you selected an Agile dashboard at Data, you should choose "Issue is in the last column of the selected board". |
| Interval Start Date | Specify a date when one (any) of the time intervals starts. This is only used by the gadget to determine when the time intervals should start. |
| Interval | Specify the duration (in weeks) for the time intervals used when calculating and displaying the velocity. |
| Display the chart for the last ? intervals | Specify the number of previous time intervals to be displayed in the chart, starting from the most recent. |
| Calculate average velocity based on last ? intervals | Specify the number of intervals to be used when calculating the average velocity. Velocity is calculated as the average of the total SPs done in each of these intervals. |
| Calculate by | Specify on which criteria the calculation to be performed. You can choose between: Story Points - the default value, use this if the issues are estimated in Story Points Original Time Estimate - use this if you use time estimates; calculation will be done in hours Issue Count - use this if you want the calculation to be done by number of issues |
Cycle Time Trend Gadget
Depending on how you configure it, this gadget can calculate the key Kanban metrics like "Cycle Time" or "Lead Time". Or, you can simply calculate the time between two Jira statuses. Use this gadget to see how fast your team delivers and to identify bottlenecks in your process flow.
- "Cycle Time" is the amount of time that the team spent working on an item without the time that the task spent waiting on the board. Therefore, the Cycle Time should start being measured, when the item task enters a "working" status, not earlier.
- "Lead Time" is the time from the moment when the request was made by a client and placed on a board to when all the work on it is completed and the request was delivered to the client. So it is the total time the client is waiting for an item to be delivered.
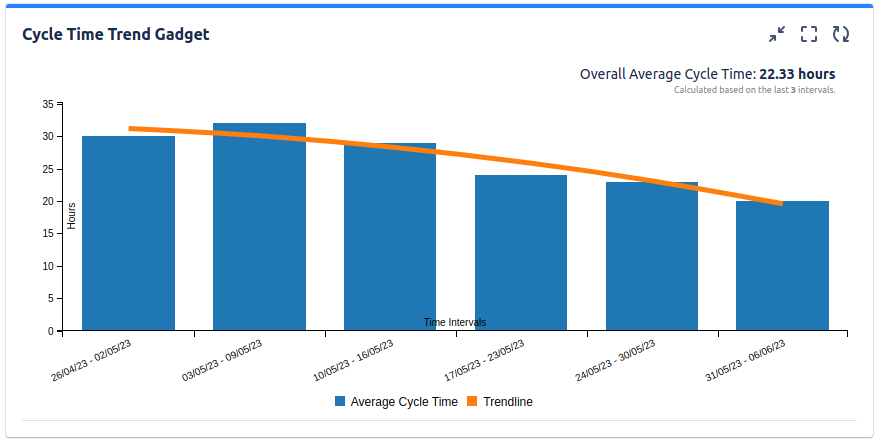
The data is displayed for a specified number of time intervals relative to a specified date. For each time interval the gadget identifies those issues from specified filter (or dashboard's filter) that had a cycle completed in that interval, determines the cycle(s) duration, calculates the average time for that interval and displays it in the trend chart.
See the settings description below for how to configure the gadget.
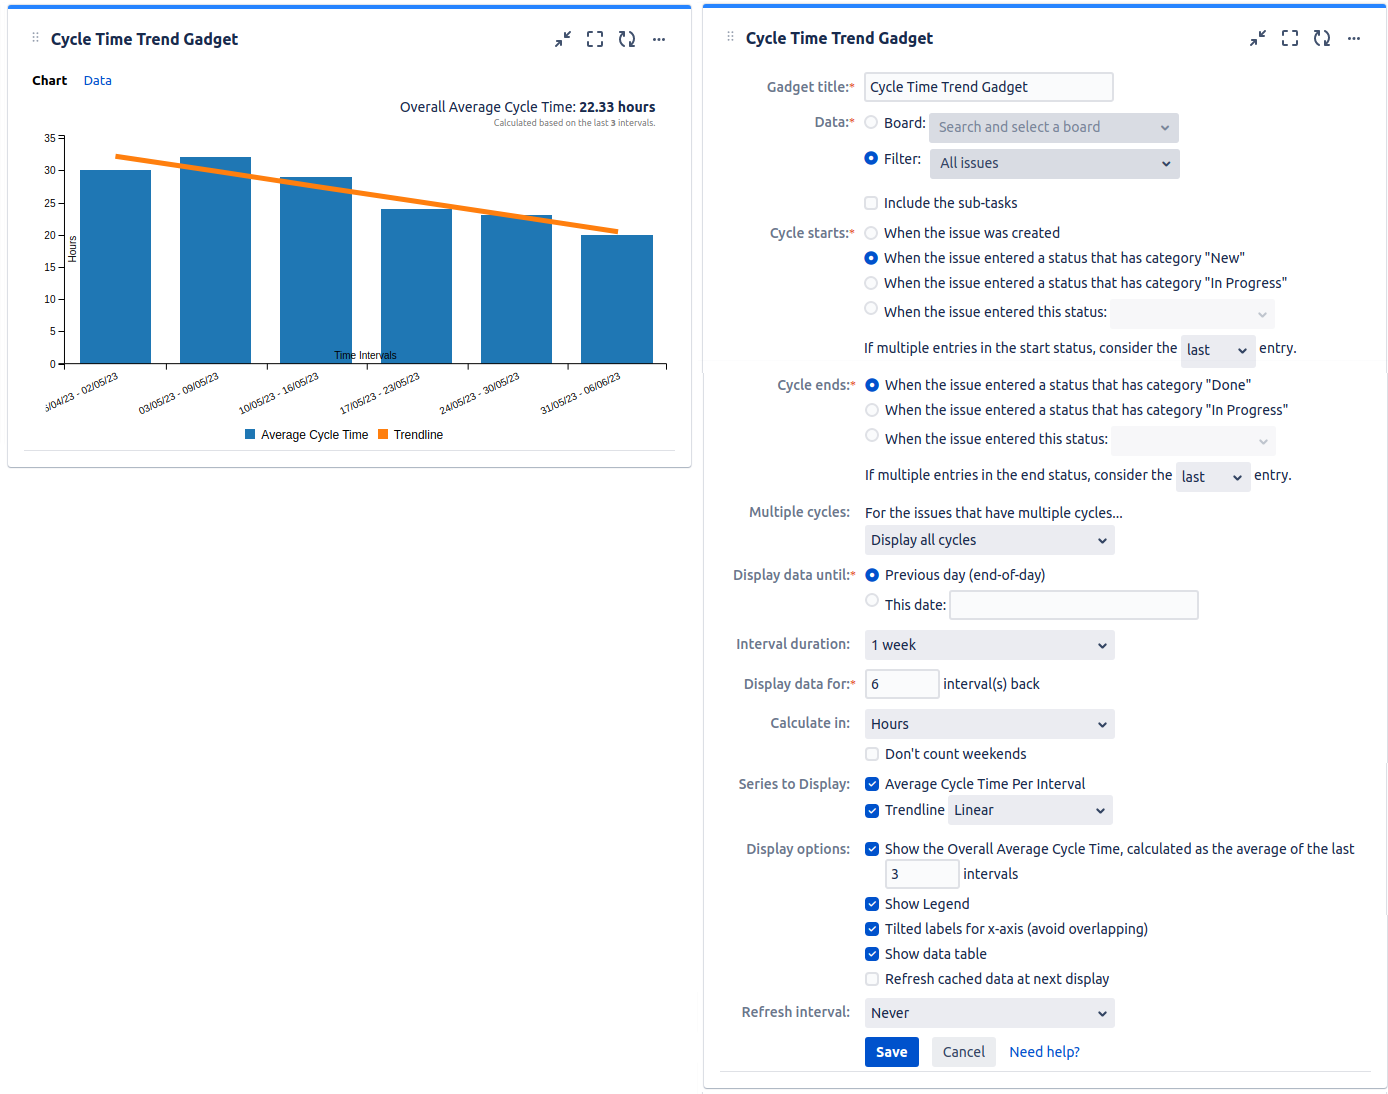
| Setting | Description |
|---|---|
| Gadget Title | Choose what to display in the title bar of the gadget. |
| Data | Choose the dashboard or Jira issue filter containing the issues for which you want the metrics to be calculated. Note: Only the parent tasks are considered in calculations; the subtasks are ignored. Make sure that the specified filter is shared with the users who will also visualize this gadget. |
| Cycle starts | Indicates what to consider as the start event of a cycle. |
| Cycle finishes | Indicates what to consider as the finish event of a cycle. Tips To calculate "Cycle Time", set the following: * Cycle starts = When the issue entered in a status that has category "In Progress" * Cycle finishes = When the issue entered in a status that has category "Done" To calculate "Lead Time", set the following: * Cycle starts = When the issue was created OR When the issue entered in a status that has category "New" * Cycle finishes = When the issue entered in a status that has category "Done" |
| Display data until: | Specify the date until the data is displayed. You can choose between: Previous day (end-of-day) - the data will be displayed until the end of yestarday, without being necessary to manually enter a date. This date - the data will be displayed until the begining of the specified date. |
| Interval duration | Specify the duration (in weeks) for the time intervals used when calculating and displaying the average time. |
| Display the data for ? intervals back | Specify the number of time intervals to be displayed in the chart relative to the date specified at "Display data until". |
| Calculate in | Specify in what time unit measure the results will be displayed. |
| Show legend | Check this option if you want the chart legend to be displayed. |
| Show data table | Check this option if you want a data table to be displayed along with the chart. Note: Displaying the data table might be resource consumming; you should use this option only if necessary. |
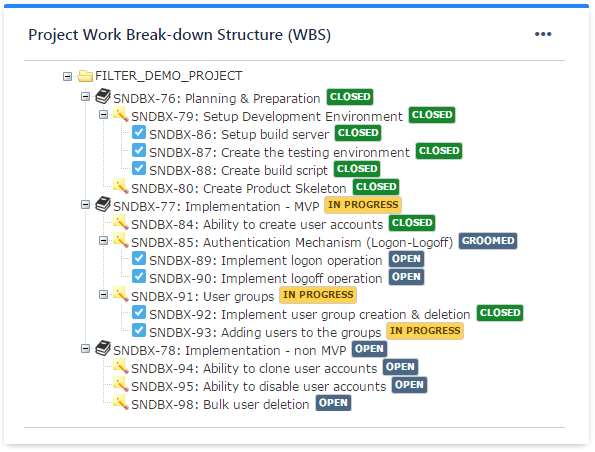
Work Breakdown Structure (WBS) Gadget
This gadget offers the Work Breakdown Structure (WBS) diagram in form of Epic > Parent Tasks > Sub-Tasks for the issues from a Jira filter. With this gadget you have the high-level status of your epics or the entire project. The issues displayed are ordered by Rank.
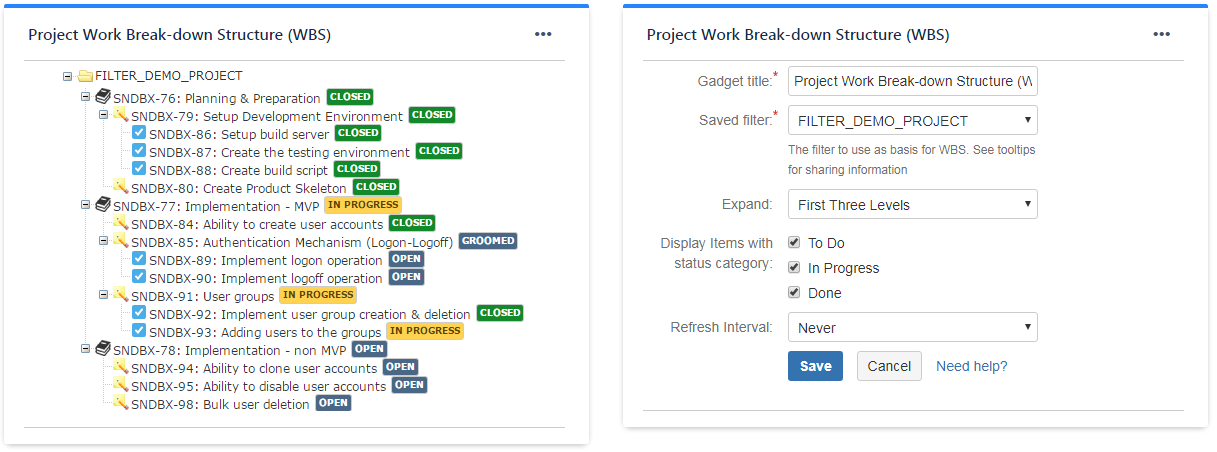
See the settings description below for how to configure the gadget.
| Setting | Description |
|---|---|
| Gadget Title | Choose what to display in the title bar of the gadget. |
| Saved Filter | The Jira filter containing the Jira issues that you want to display. It can be a filter containing one of more epics, or your entire project. Make sure that the specified filter is shared if you want the other people to visualize the dashboard. |
| Expand | Specify how many levels to be expanded by default right after displaying the gadget. |
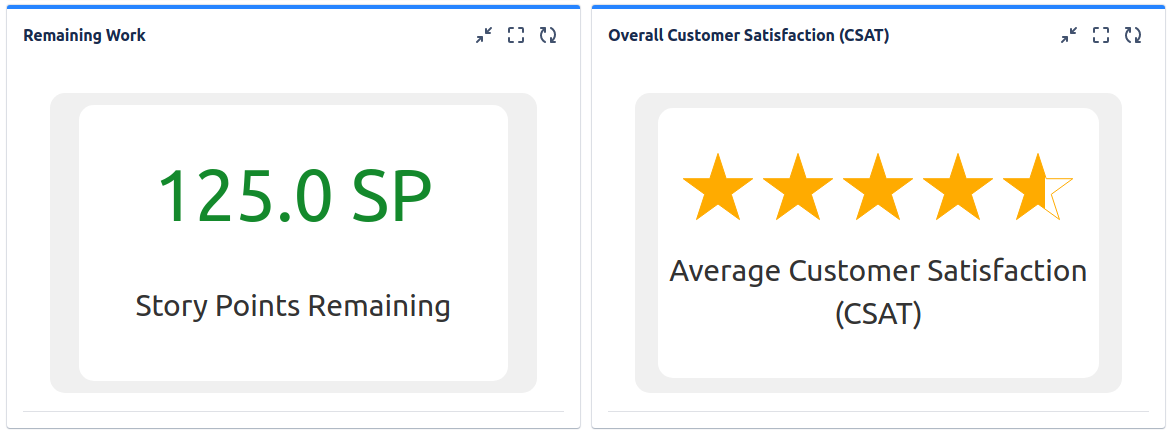
Issue Filter Formula Gadget
Calculates and displays the result of a simple formula (like SUM, MAX or AVERAGE) on a numeric field of the issues from a specified Jira issue filter. Use this gadget to display, for instance, the total remaining work or the the work done in your project.
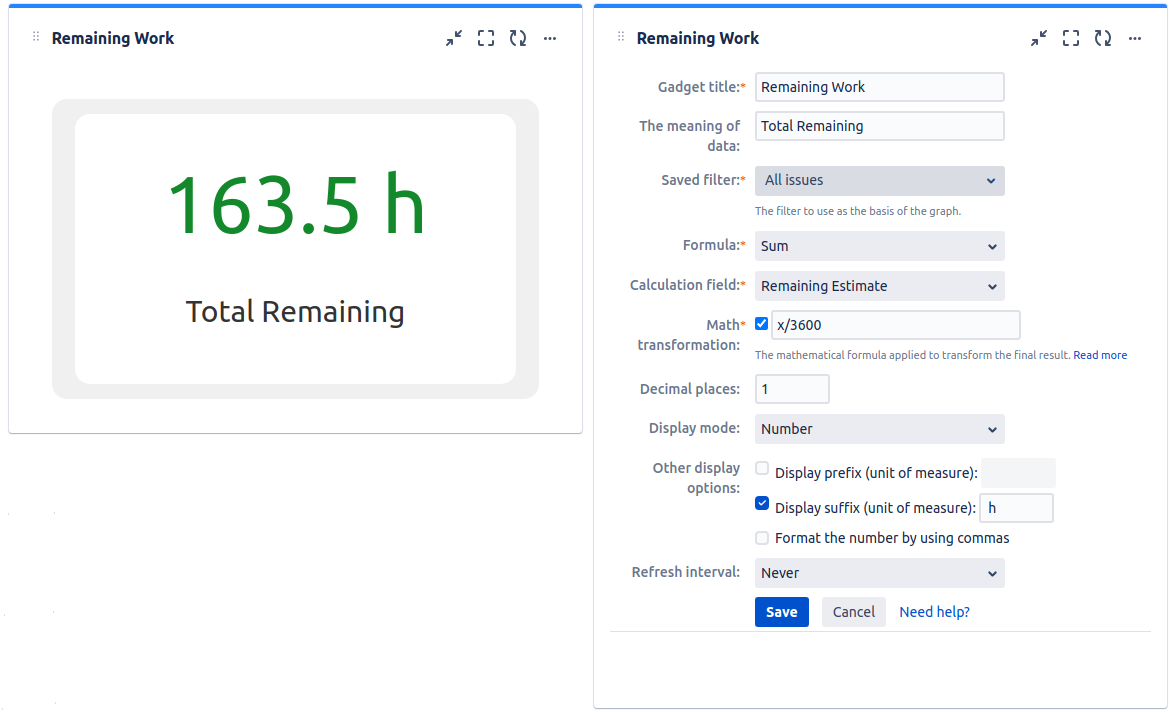
See the settings description below for how to configure the gadget.
| Setting | Description |
|---|---|
| Gadget Title | Choose what to display in the title bar of the gadget. |
| The Meaning of the Data | Specify the text to be displayed under the calculated value representing the meaning of that value. |
| Saved Filter | The Jira filter containing the Jira issues for which you want to do the calculation. Make sure that the specified filter is shared if you want the other people to visualize the dashboard. |
| Calculation field | Select the Jira issue field to use for calculation. You can chose from a list of the numeric fields available in your Jira instance. |
| Formula | Choose the basic formula (Sum, Average, Min or Max) for being used in calculation. |
| Math transformation | Optionally, you can apply an extra math formula over the result of the basic formula. With this extra math formula practically you will modify the final result with any operation or math function as you want. The formula must contain "x", which represents the result of the initial basic formula. A good example is when you use a basic formula against a time field of Jira, like Original Estimate or Remaining Estimate. Jira stores the values of these fields in seconds and the result of the basic formula will be also in seconds. To transform in hours, you must apply the math transformation "x/3600". |
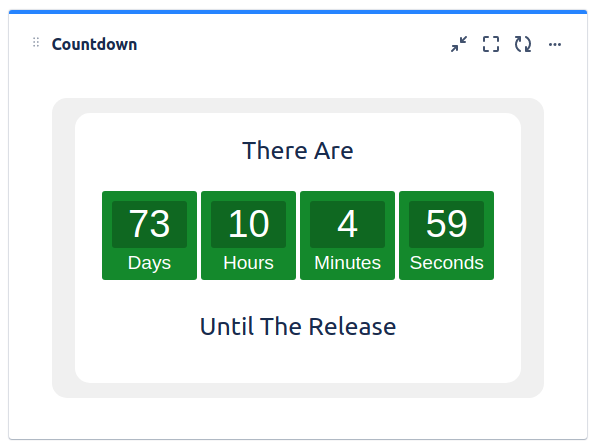
Countdown Gadget
This gadget shows the remaining time until an upcoming event. Use this gadget to make your team aware of the remaining time until the next project launch or milestone, the Christmas Party or any other important event for your team or company.
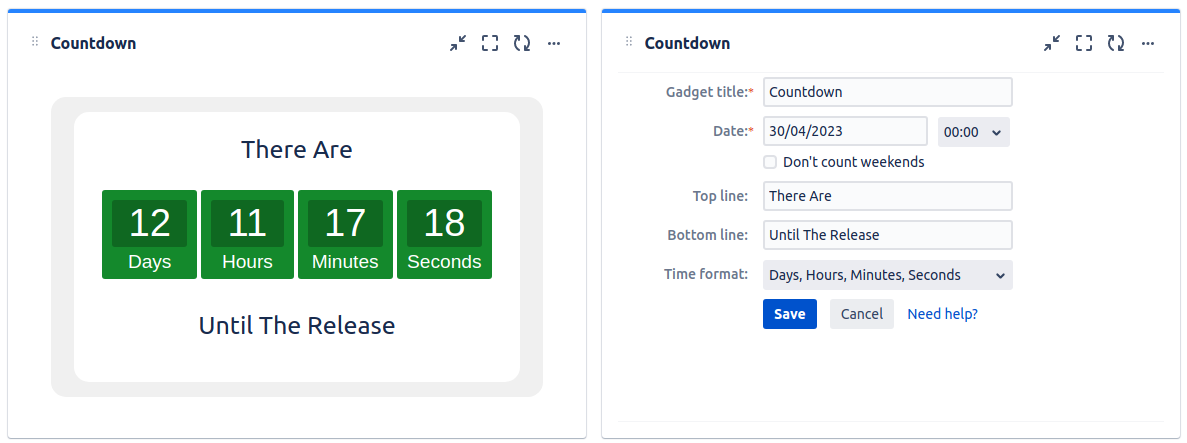
See the settings description below for how to configure the gadget.
| Setting | Description |
|---|---|
| Gadget Title | Choose what to display in the title bar of the gadget. |
| Date | Specify the date and time for the upcoming event. |
| Top line | The text to be displayed on the line above the remaining time. |
| Bottom line | The text to be displayed on the line below the remaining time. |
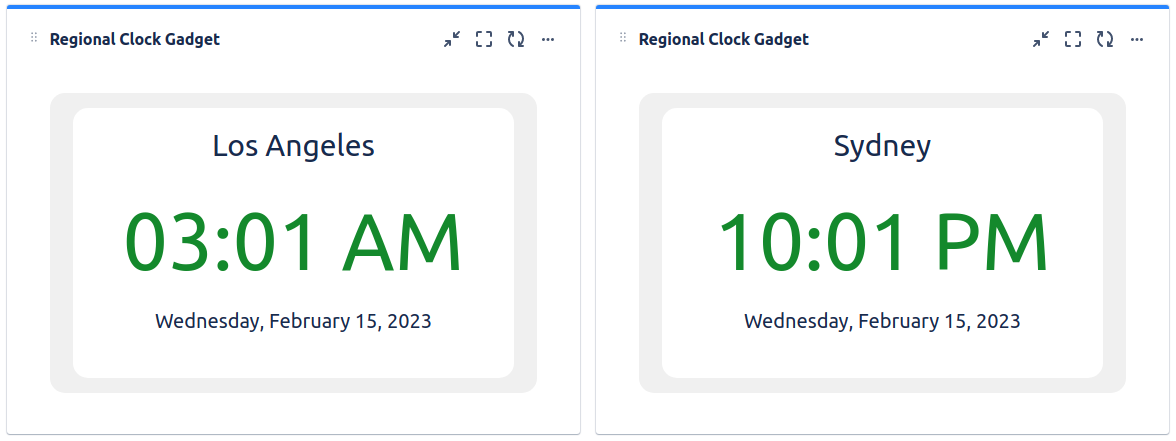
Regional Clock Gadget
This gadget shows the current time in a specific location in a digital clock format. It is useful for companies with multiple offices across the world or geographically distributed teams. Use this gadget to make your team members know what the current time is in the other offices so they can better synchronize with the remote people.
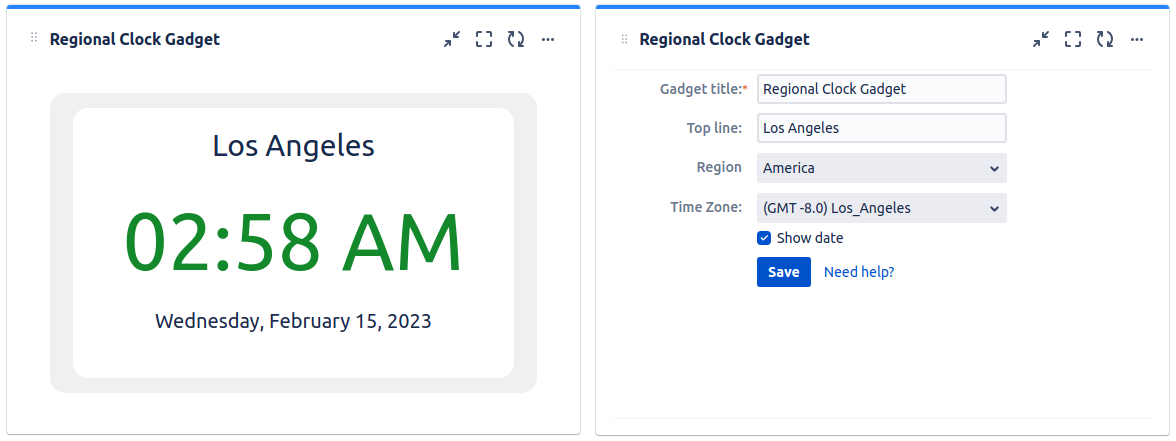
See the settings description below for how to configure the gadget.
| Setting | Description |
|---|---|
| Gadget Title | Choose what to display in the title bar of the gadget. |
| Top Line | Specify the location for being displayed on the top line. |
| Region | Select the region for which the time to be displayed. |
| Time Zone | Select the city or the time zone for which the time to be displayed. |
| Show Date | Check this if you want the current date to be also displayed. |